1) Motivation
A world where everybody is connected to each other offers a lot of advantages to music fans: They can search for songs, listen to them via streams and even buy them. But what if you are looking for new bands or songs? Search through thousands of lists or directories? The best solution would be a tool generating a list of bands in which you may be interested based on your favourite bands.
There are many ways how such a tool could work: It could analyze the frequencies of a song, it could calculate a result based on genres or use sales figures as source. But what about basing it on the music taste of your favourite bands?
If we follow that last idea, where should we get the data? The best place to start would be the internet and its blogs, communities, etc. But you don't just want the taste of a simple user, you want the band's taste. You need a community where bands can promote themselves and connect with other community members (especially other bands).
That also brings us to another issue: How active is the community of a social network? Are they using their accounts on a regular basis? Will the data be sufficient for such an application?
2) Introduction
B.A.S.S (band analysis and suggestion system) is a software application which analyzes, visualizes and calculates data based on the social network of www.MySpace.com., or to be more correct, on the social network of musicians within MySpace.
B.A.S.S. itself is separated into three different parts.
First there is the suggestion system. It offers a list of bands (the user may not know of), based on the user's input bands. To be more precise, the algorithm calculates points for all bands on the friendlists of the selected musicians/bands and their connections with each other.
Second there is the statistics part which offers various graphs and rankings of the registered bands at MySpace for example the amount of registered bands per day, the ratio between active and inactive bands or the growth of every genre since the launch of MySpace.
The third part of the application is the 3D visualisation of connections between bands via friendlists. Since we found no open source 3D-Engine fitting our requests we had to develop an adequate engine ourselves, able to display the network of a single band and (optionally) the networks of the bands on the first band's friendlist.
Written in Java/Java3D the software is completely OS independent.
Link to the sourceforge project: www.sourceforge.net/bass
Link to the project's website: http://bass.sourceforge.net
This software was developed as a student project within the course “media management and production” at the university of applied sciences Zweibruecken.
3) Requirements
1GHz CPU or higher
4) Installation
4.1) Installing the Software using the installer:
Most operating Systems support launching the jar-installer via double-click, if your OS does not support this kind of launch or if you are using a shell based system you need to launch the file with a java command:
e.g. java -jar „Bass 0.1 alpha Installer.jar“
A graphic interface will guide you through the installation process
4.2) Installing the software from a zip-file
extract the file to a folder of your choice
5) Using B.A.S.S.
5.1) How to run the software
Go to the installation folder, this is the folder you have chosen in the installer or extracted the zip-file to (depends on how you have installed B.A.S.S.)
Note: you may also start the program with a console command like this:
java -Xms128m -Xmx512m -jar Bass.jar
Note: it's not possible to run the program more than once at the same time, multiple launches will cause a database error. If you have launched the software twice or more by accident close the newest launch(es) and use the first one.
Please do not start the Bass.jar file via double-click, the program may start but the Java heap sizes won't be big enough to run the software properly.
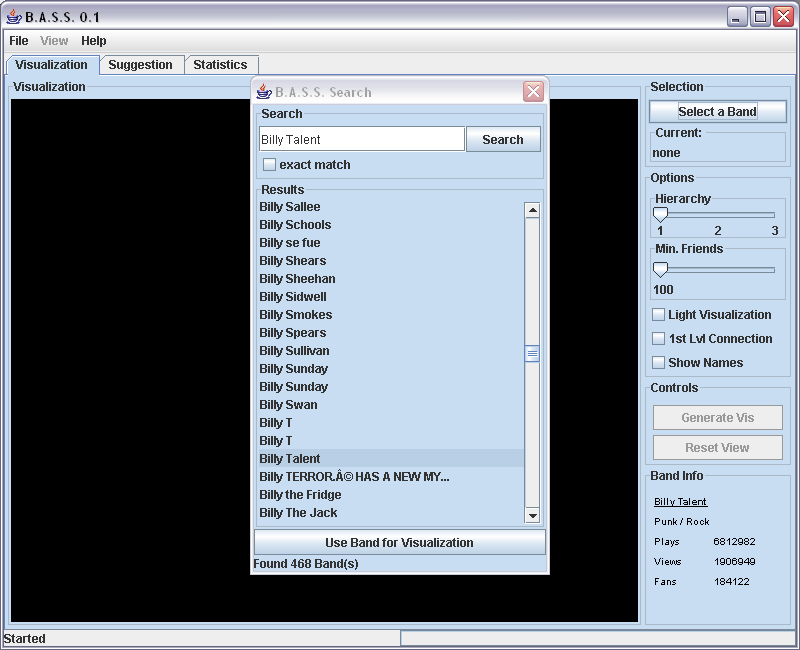
You should be seeing a small startup screen for a few seconds, afterwards the B.A.S.S. main window opens:

The program is divided into three main sections Visualization, Suggestion and Statistics. The following chapters will explain you how to use the different functions.
5.2) The Visualization component
The main task of this component is to generate a three-dimensional representation of a bands surroundings. This is based on the bands the „start band“ has on it's friends list. To generate a visualization perform the following steps:
Step 1 – Selecting the „start band“
Click on the „Select a Band“ button

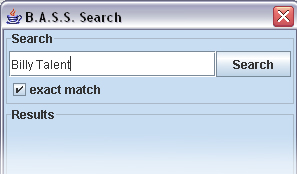
By default „exact match“ is selected this indicates that your search term needs to be the exact bandname. If you turn of this function the search result will contain any band having at least one of the words in the search term in their name. For example searching for „Billy Talent“ with exact match turned on will return the band „Billy Talent“, the same search with exact match turned of will return any band having the word „billy“ or „talent“ in their name. The result may contain „Billy Idol“ or „Wasted Talent“. Note that turning of exact match will slow down the search speed.
After a short search time the result will display in the result
window. Click on a band and a short information about them will
appear in the lower right corner of the main window. If you have
found the band you searched for first click on the band then click
on the „Use Band for Visualization“ button. The search
window will disappear and the selected bands name will be shown as
current selection.

Step 2 – Setting the options
You can adjust the following options to optimize the visualization:
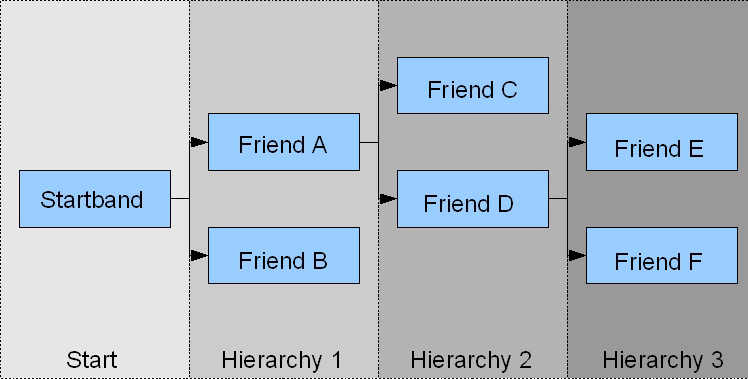
Hierarchy: This value specifies how deep the visualization will be generated. Set the value to 1 if you just want to see the bands on the start bands friendlist, setting the value to 2 will also show bands appearing on the friendlist of one of the bands on the start bands list.
Note that hierarchy level 3 is not implemented yet.
Min. Friends: This is a filter to cut away mass-data, the value specifies the minimum number of friends that a band needs to have to appear in the visualization.
Light Visualization: This check-box can be used to turn on/off the connection lines between the friends.
First Level Visualization: If this option is checked the connection lines from the start band to its friends are drawn, it may be helpful to uncheck this option if the visualization seems to be overloaded.
Show Names: check this option to enable displaying band names in the visualization
Step 3 – Generate the Visualization
After you have set the options just press the „Generate Vis“ button to generate the Visualization. After some time of calculating the Visualization will appear in the left window.
Step 4 – Navigating
To navigate in a visualization B.A.S.S. offers following commands:
hold the left mouse button and move the mouse to rotate the view
Note: If you ever get lost in the Visualization simply use the „Reset View“ Button.
5.3) The Suggestion Component
This component suggests a list of bands to you, which you might like, based on one or more bands you use as input. This system uses the connection of the bands via their friendlists to calculate the suggestions. To generate a suggestion list perform the following steps:
Step 1 – Selecting start bands
Click the „via Search“ button to get the search form (which you already know from the visualization component, check chapter 3.2 step 1 for some information about this window). Search for the bands you like, select them in the result list and click on „Add selected bands to Suggestion List“. The band(s) will appear in the list on the right side of the main window.
Note 1: Selecting bands via directory is not implemented yet.
Note 2: You can select multiple bands from one result page, simply hold CTRL while clicking on the bandnames (this feature is just enabled in the search window for the suggestion tool)
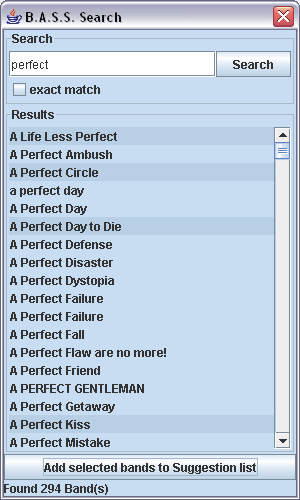
To reset the start band list just click on the reset list button under the list.
Step 2 – Setting the options
Currently there is only one option available in the suggestion system:
deep search: check this option to enable a deeper crawl mode, this may find more bands but this may also take a lot more time to calculate.
Hint: try calculating without the deep search option first, if the result is not satisfying to you, enable it.
Step 3 – Generating the list
To generate the suggestion list simply click the „Start“ button. Calculating may take a while since a huge amount of data is used (especially if you have checked the deep search option).
Step 4 – Using the list
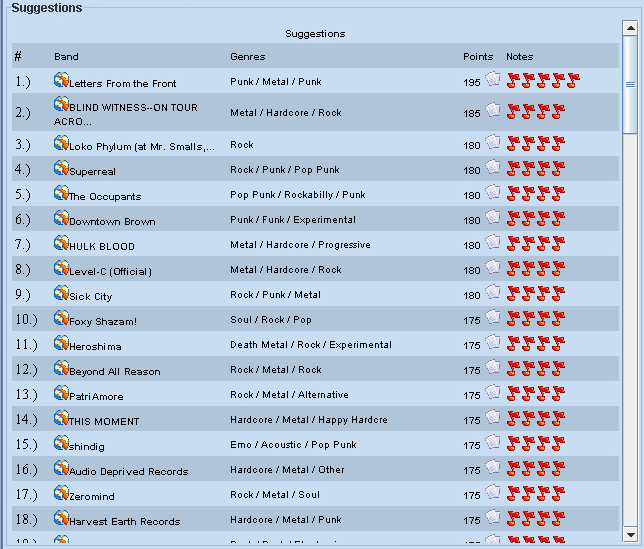
The suggestion list displays the Top100 of bands you might also like
according to the bands you have used as input data. Clicking on the
![]() -icon takes you directly to the bands mySpace page. Note that this
opens your default browser: it may not work on some OS or if you have
not set a default browser). The
-icon takes you directly to the bands mySpace page. Note that this
opens your default browser: it may not work on some OS or if you have
not set a default browser). The ![]() -icon opens a small pop-up showing
the list of bands from whom the current bands received its ranking
points. And finally the
-icon opens a small pop-up showing
the list of bands from whom the current bands received its ranking
points. And finally the ![]() -icons represent the ranking of the bands,
five notes is the best score while one note is the worst.
-icons represent the ranking of the bands,
five notes is the best score while one note is the worst.
5.4) The Statistics Component
This component is pretty simple to use: there is a selection menu on the right side of the screen. Here you can choose various charts and statistics: simply click on the one you want to see and it will be generated and loaded to the screen. You will also find a small information text at the bottom of the screen.
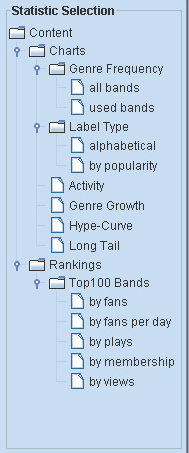
While a table is being displayed you may visit the bands mySpace page simply by clicking on the bandname

There are several options to navigate in an graph, a right-click into the graph openes a small menu with the following options:

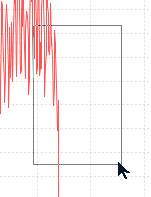
To zoom into the graph click into the graph with the left mouse button, hold the button and move to mouse to specify an area. You will see a square indicating your current selection. Release the mouse button to zoom in. To zoom out click in the graph, hold the mouse button and move the cursor to the upper left of the area, then release the button.
